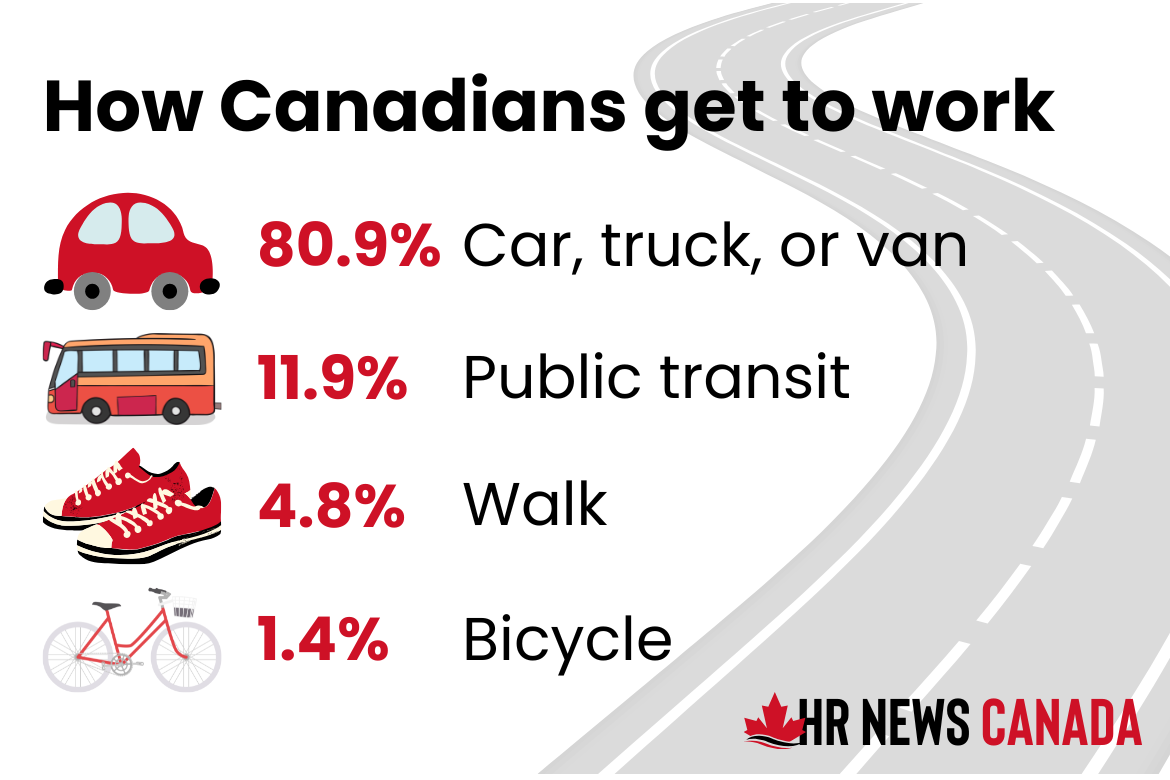
The number of Canadians commuting to workplaces outside their homes rose again in May 2025, marking the fourth consecutive year of increases, according to new data from Statistics Canada.
The share of employed people who were commuters reached 82.6 per cent, up 1.3 percentage points from May 2024. That compares with a pandemic-era low of 75.7 per cent in May 2021. At the same time, the proportion of workers mostly working from home fell to 17.4 per cent in May 2025, down from 18.7 per cent a year earlier.
Cars remain dominant way to get to work
While cars remain the dominant way Canadians get to work, their share has steadily declined since 2022. In May 2025, 80.9 per cent of commuters mainly travelled by car, truck or van, down from 81.5 per cent a year earlier and from a peak of 84.2 per cent in 2022.
Public transit accounted for 11.9 per cent of commutes, up from 11.4 per cent the previous year. The figure remains below the pre-pandemic level of 12.6 per cent recorded in 2016. Active transportation—walking or cycling—was the primary mode for 6.2 per cent of commuters.
Among major census metropolitan areas (CMAs), car use was highest in Windsor (93.2 per cent) and St. Catharines–Niagara (91.9 per cent) and lowest in Toronto (69.4 per cent), Montréal (70.0 per cent) and Vancouver (70.1 per cent).
Ottawa–Gatineau sees biggest jump
The proportion of commuters increased the most in Ottawa–Gatineau, climbing 9.5 percentage points to 76.0 per cent between May 2024 and May 2025. That brought the capital region closer in line with other CMAs such as Toronto (76.1 per cent), Victoria (78.3 per cent) and Vancouver (79.2 per cent).
Winnipeg recorded the highest share of commuters at 89.5 per cent, followed by Windsor at 87.4 per cent.
Commute times lengthen in Toronto
Nationally, average commute times held steady at 26.7 minutes in May 2025. But Toronto commuters faced the longest travel, averaging 34.9 minutes — up 1.6 minutes from a year earlier. Vancouver (31.1 minutes) and Montréal (29.0 minutes) also posted above-average commute times.
Neighbouring CMAs such as Barrie (31.6 minutes), Oshawa (30.8 minutes) and Hamilton (29.1 minutes) similarly recorded longer trips than the national average.
By mode of transportation, transit users spent the most time commuting, averaging 44.1 minutes. Car commuters averaged 24.7 minutes, while those walking or cycling had the shortest commutes at 15 minutes.
Longer commutes for racialized groups
The data also highlighted differences among racialized populations. South Asian commuters averaged 31.9 minutes, Black commuters 30.1 minutes and Chinese commuters 31.4 minutes, compared with 24.8 minutes for non-racialized, non-Indigenous workers.
Long commutes — defined as 60 minutes or more — were most common among West Asian (20.4 per cent), South Asian (15.9 per cent) and Latin American (15.7 per cent) commuters. For non-racialized, non-Indigenous workers, the share was 8 per cent.
Roughly one in four Black (25.7 per cent), Latin American (25.3 per cent) and Filipino (24.4 per cent) workers primarily took public transit, compared with 6.8 per cent of non-racialized, non-Indigenous commuters.